Cafe Colonial · Investor deck 2026

Green to roast.
Wholesale to retail.
One coffee company.

Cafe Colonial is an American coffee company that sells green, unroasted coffee and roasted coffee through both wholesale and retail channels nationwide. The model captures value at two stages of the supply chain, in one brand, with one P&L.

$90.1B

US coffee revenue, 2025
Statista

66%

of US adults drink coffee daily
NCA 2025

~9.6%

specialty coffee CAGR to 2030
Grand View Research

40,000+

US coffee shop locations
World Coffee Portal

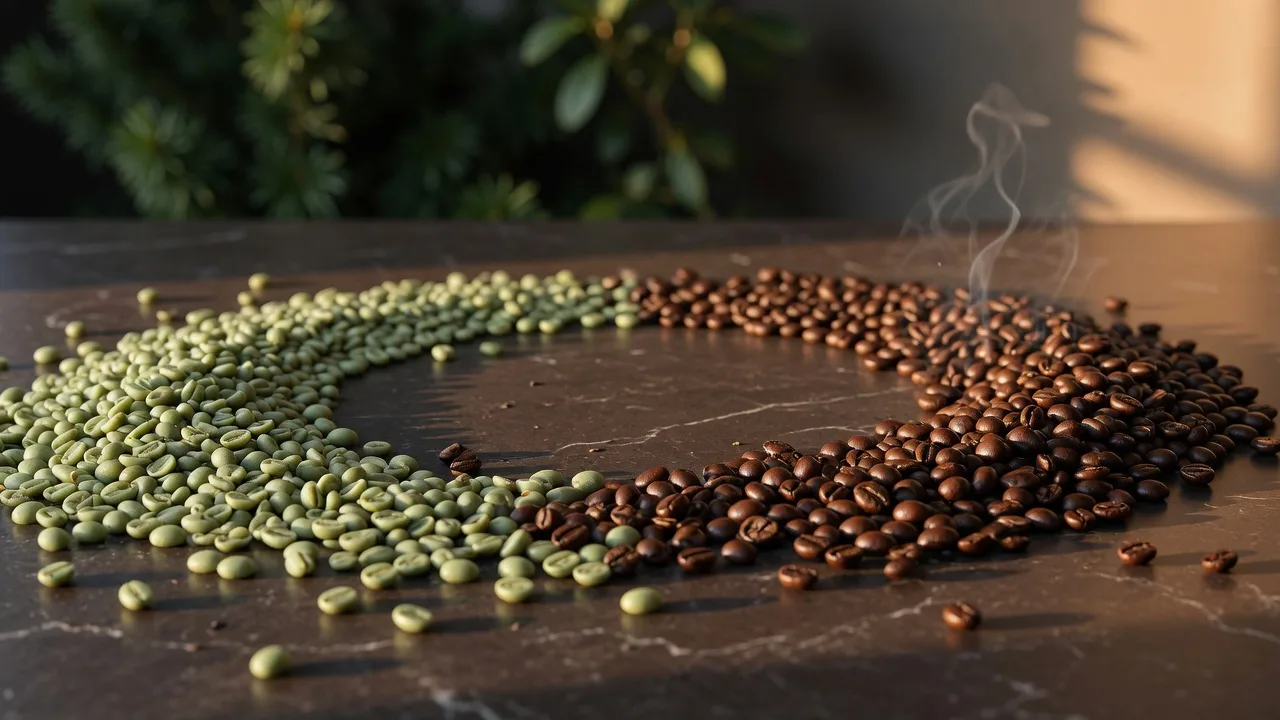
Pale green unroasted coffee beans sweeping into glossy roasted beans across a dark stone surface

The full path, one P&L

Origin → Green lots → Roasted → Wholesale → Retail

Specialty share

46%

past-day, NCA 2025

01 · Executive summary

The dual model, in two sentences

Cafe Colonial operates one integrated company across the two halves of coffee commerce that are almost always run separately: green and roasted, and wholesale and retail. We buy and import green coffee, sell commodity and specialty lots to roasters and foodservice, roast a growing share of our own volume, and sell the roasted result to coffee shops, restaurants, grocers and buyers direct.

Every pound that moves through us can earn margin twice: once as green goods, again as a roasted, branded product. The two loops fund and de-risk each other.

Origin Green import Roast Wholesale Retail

Green, wholesale

Commodity and specialty green lots sold to roasters on volume contracts and annual supply programs.

Green, retail

Home-roasting packs and small-lot origins sold direct, with subscription options.

Roasted, wholesale

Whole bean, ground and blends supplied to shops, restaurants, kiosks, cafeterias.

Roasted, retail

D2C e-commerce, subscriptions and branded shelf lines in specialty grocery.

02 · The opportunity

America drinks a $90 billion cup. Specialty is the growth engine.

The US coffee market generated an estimated $90.1 billion in revenue in 2025 (Statista), and industry trackers project low-to-mid single-digit annual growth through 2030. Within it, the specialty segment outpaces the broader market several times over: Grand View Research models US specialty coffee growing at a CAGR around 9.6% to roughly $80 billion by 2030. A company positioned on both the commodity-scale green side and the premium specialty roast side is built to ride every register of that growth.

66%

of US adults drink coffee every day

A 20-year high, up ~7 points since 2020. National Coffee Association, 2025.

~3

cups per day for daily drinkers

Coffee leads all purchased beverages. NCA 2025.

46%

drank specialty coffee in the past day

Passing traditional coffee (42%) for the first time. NCA 2025.

$8.6B

of green coffee the US imports a year

The largest green-coffee consumer market in the world.

US coffee market revenue, size in motion

$ billions, 2025 base (Statista)
90.1
2025
93.4
2026
96.9
2027
100.5
2028
104.3
2029
108.5
2030E

Projection line modeled at a ~3.8% CAGR to ~$108.5B by 2030, in line with Research and Markets (3.7% to 2033) and IMARC (3.5% to 3.9% to 2034). Roasted coffee is the largest segment, about $77B in 2025.

Specialty segment

The premium lane grows fastest

$46.7B

US specialty sales, 2024

$80B

projected by 2030 · +72%

Grand View Research: ~9.6% CAGR, 2025 to 2030. Espresso-based drinks are the fastest format, up 17% among adults since 2020.

Green coffee, overlooked

The input market is growing, too

The global green coffee market is roughly $37 to $38 billion, growing ~4% to 5% a year. North America accounts for roughly 35% of global consumption, and the US lets about $8.6 billion of green coffee through its ports each year. Few of the buyers of that coffee are also brands.

03 · Go-to-market

Five channels, two engines

Wholesale and retail are not two businesses in the plan, they are two engines on one brand. Wholesale drives volume, tenure and forecasting. Retail drives margin, brand equity and household penetration.

The wholesale engine

Contracted volume, case pricing, a named G&R roaster on the menu, and a green supply program when the buyer roasts their own.

The retail engine

D2C e-commerce, subscriptions and branded shelf lines, each one zero-footprint retail with full margin.

How it flows. A shop takes wholesale roasted this month, the tonnage turns into shelf-level branded retail bags next; a roaster takes green lots in April and orders roasted solids by September. Every channel feeds the others.

Coffee shops

The anchor customer: 40,000+ US outlets, and independents re-brand to local roasts.

Wholesale:
Volume bean and ground programs, menu placement, barista training.
Retail:
Co-brand retail bags on the counter, take-home case-packs turn into margin.
5-yr:
28% of revenue at year 5

Restaurants

Foodservice coffee is an end-of-meal decision with strong repeat dynamics.

Wholesale:
BIB and bag programs to full-service and limited-service chains.
Retail:
Retail-pouch sell-through at the counter and banquet amenities.
5-yr:
15% of revenue at year 5

Kiosks & carts

High-margin espresso pods in offices, transit, airports and malls.

Wholesale:
Compact workstations and programmed serving sizes, low waste.
Retail:
QR-code repeat orders and brew-at-home bundles.
5-yr:
7% of revenue at year 5

Supermarkets & grocery

The pantry lane where branded roast meets household penetration.

Wholesale:
National distributor partnerships, shelf-ready cases, promo support.
Retail:
SRP per bag, club packs, store-brand roasted and green formats.
5-yr:
20% of revenue at year 5

Specialty roasters

The green-coffee buyer class: ~2,000+ craft roasters across the US.

Wholesale:
Lots by grade, sample programmes, FOB and CIF contract terms.
Retail:
Green "roast-at-home" units for their home customers.
5-yr:
20% of revenue at year 5

Direct (D2C)

Web shop and subscriptions that deepen each wholesale relationship.

Wholesale:
Seed orders from account managers; coffee gifts and wholesale starter kits.
Retail:
Subscriptions, one-time bags, home-roaster clubs, corporate gifting.
5-yr:
10% of revenue at year 5

04 · Products

Green on the left, roast on the right

One buying desk, two product families, four grades of coffee, and a library of roast profiles that give every customer a SKU set, not a single bag.

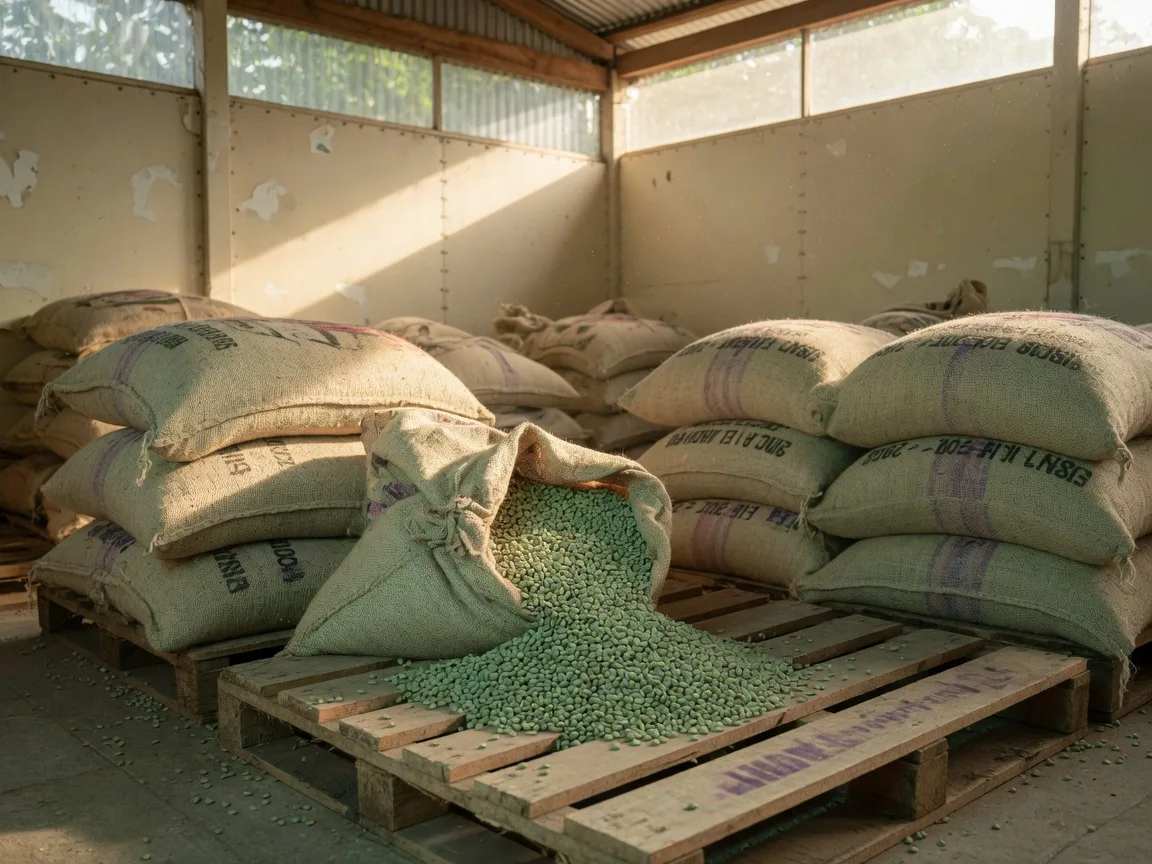
Burlap sacks of pale green unroasted coffee beans in a bright origin warehouse
Green coffee (unroasted)

Sold by the bag, by the container, by the contract

Commodity grade

Commercial C-commerce lots, fixed and float pricing, robust volume for roasters who push the every-day cup.

Specialty grade

Q-graded, at least 80+ scores, traceable to origin and to producer signature, bagged and sealed for craft roasters.

Sourcing model

Multi-origin contracting: Central & South America, East & West Africa as the core books; fixed-price positions plus shadow flex for consistency.

Roasted coffee

Whole bean, ground, and blends, in named roast profiles

Whole bean & ground

A core line of single-origins and medium-plus blends, plus a cafés-grade line tuned for espresso bars and restaurant service.

Blends, built for the menu

Signature espresso, filter and decaf (EA and Swiss-water-style) blends: development profiles written to customer equipment first.

Roasting notes

Small-batch drum roasting, roast-to-order windows, RFID lot tracing, and a cupping lab on the second fastest drum.

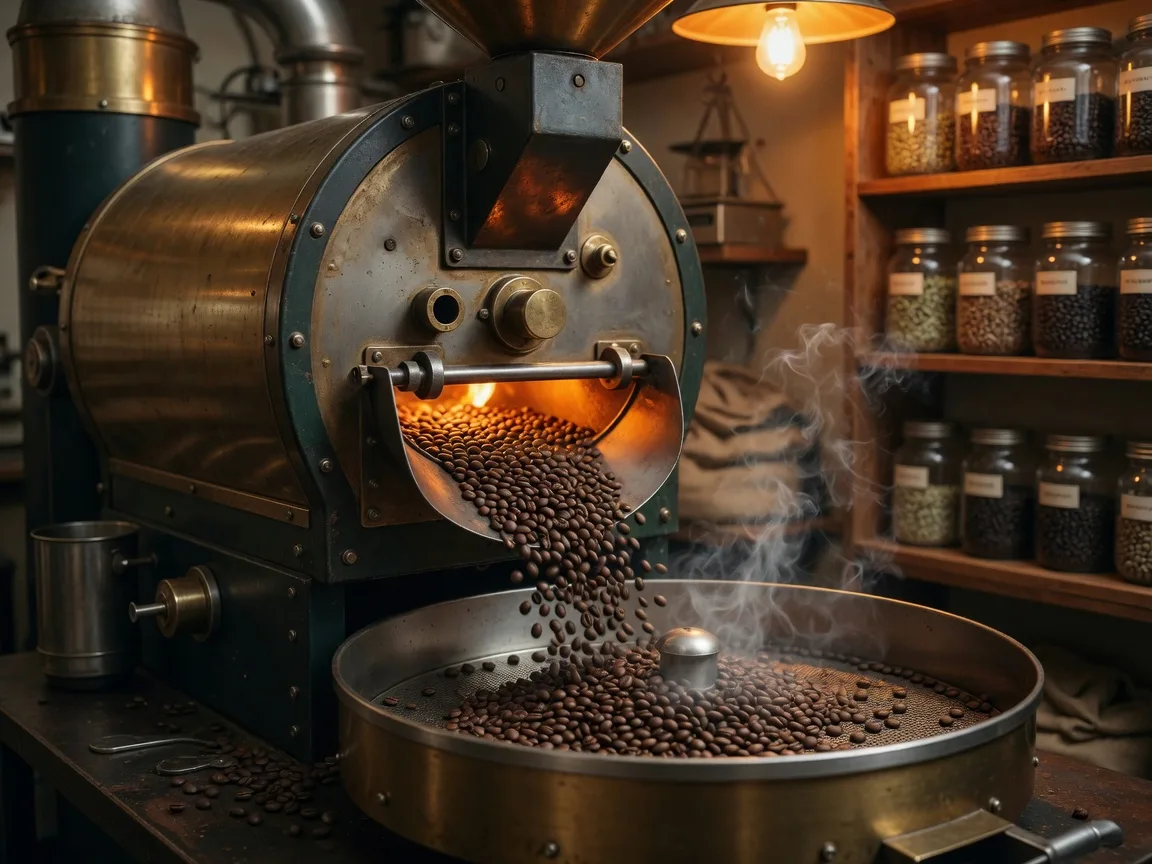
A brass and steel drum coffee roaster mid roast with roasted beans tumbling into a cooling tray

2 grade ladders

commodity to specialty, one grade ladder per product line

6+ formats

green bags, whole bean, ground, pods, k-pods, cold-brew-ready

Roast-to-order

freshness shelf as the customer promise

05 · Revenue model

Recurring by design, not by accident

Coffee is one of retail's most habitual purchases. The model is built to convert habit into contracts, and contracts into a growing share of each customer's coffee spend.

Target mix

70%

wholesale

Wholesale roasted 50%
Wholesale green 20%
Grocery & retail 20%
D2C & subscriptions 10%

Wholesale contracts

  • Annual volume contracts with minimum points and laddered growth
  • Case & container pricing with rebates at tier thresholds
  • Named co-brand programs locked for 12 to 24 months

Retail pricing

  • SRP-led bag pricing: one price family across grocery, café and D2C
  • Farm-to-table margins: 40-55% brand gross on roasted formats
  • Clearance and bundle mechanics kept off the main catalogue

Subscriptions & recurring

  • Roasted coffee subscriptions (2, 4, 12-week cycles)
  • Green "home roast club" supply agreements
  • Evergreen account: every current account rolls into a recurring program

Indicative model parameters shown in the mix chart and margin lines are plan assumptions, not audited figures; they are refreshed at each model cadence.

06 · Market projections

The plan: five years, three growth multipliers

Management targets (illustrative) assume the dual model compounds: wholesale contracts renew, retail households grow, and green trade scales with the roaster customer base. Revenue is modeled at a ~53% blended CAGR from Y1 to Y5.

Five-year revenue plan

US$ millions, wholesale + retail

1.5
Y1
2.6
Y2
4.1
Y3
5.9
Y4
8.2
Y5

Y1 launch: origin contracts, first wholesale accounts, D2C live by mid-year. Y5: 3 core channels at scale across the US, with about 400 active recurring accounts.

Growth multipliers

1 · Contract renewal: wholesale agreements create 18-36 month visibility.

2 · Branded retail margin: every wholesale pound that turns branded lifts blended margin ~8-12 points.

3 · Green trade scale: container-lot economics improve as origin positions consolidate.

Plan CAGR

53%

blended 5-year revenue, base case. All plan figures are illustrative management targets.

Regional coverage, US

Illustrative share of plan revenue, year 5

Northeast

NYC · Boston · DC · Philly

26%

Coffee shops, retail, grocery anchors

Southeast

ATL · Nashville · Miami

24%

Restaurants, hotel & office amenity

Midwest

Chicago · Minneapolis · Detroit

20%

Supermarkets and cafeterias

Southwest

Dallas · Houston · Phoenix

18%

Foodservice and retail kiosks

West / PNW

LA · SF · Seattle · Portland

12%

Specialty roasters and D2C

Service map: wholesale logistics via regional depots; retail and D2C ship nationally from roastery inventory. Regional figures are target allocations, not commitments.

07 · Competitive landscape

Nobody in the room runs both sides

The US market splits into commodity importers, regional craft roasters, restaurant brands and big retail chains. Each owns one lane. Cafe Colonial treats green-plus-roasted, wholesale-plus-retail as one integrated order book.

Capability Commodity importers Regional roasters National chains Cafe Colonial
Green coffee supply Core business Buy as input Third-party Owned, grade ladder
Roasted brand line Not offered Core business Private label Owned profiles
Wholesale channel Contract Local reach Mass scale Dual-model contracts
Retail & D2C Limited Café-anchored Strong Brand + subscription
Subscriptions / green clubs Rare Rare Some Both formats

Dual-margin structure

Green and roasted each earn a margin; the two loops offset commodity cycles.

Channel integration

Wholesale accounts and retail customers share one forecast, one inventory, one brand.

Sourcing control

Contract positions mean visible green costs feed stable roasted pricing.

Recurring base

Contracts plus subscriptions cap downside and shorten the sales cycle over time.

08 · Team & operations

Founder-led, operationally lean

The plan is built to be run by a small senior team early: a founder who owns sourcing and the customer roadmap, a head roaster on the first drum, and a sales lead opening the first region.

About the company & the founder
E

Emilio

Founder & Managing Partner

Emilio started Cafe Colonial around a working observation: the coffee trade earns its most consistent margins on the green side, its most premium ones on the roasted side, and almost no one holds both in one P&L. He set the company up to exploit exactly that seam, and now owns sourcing policy, roast profiles and the customer roadmap day to day.

Year 1 hires

· Head Roaster

· East & Southeast Sales Lead

· Operations & logistics manager

Year 2-3 hires

· Head of Sourcing (green trade)

· Grocery channel director

· Finance & planning

Operations plan

Small-batch drum roastery (capacity grows with demand), a cupping lab on the same floor, bonded green storage for container lots, and a single integrated order book across wholesale, green trade and D2C from day one.

09 · Financial outlook

The outlook at a glance

Five-year management targets: revenue to $8.2M, gross margin to the high 40s, and EBITDA turning positive during Year 3 as the wholesale book reaches critical mass. Full year-by-year model on request.

Plan year Year 1Year 2Year 3Year 4Year 5
Wholesale roasted share 60%56%54%52%50%
Wholesale green share 10%12%15%18%20%
Grocery & retail share 18%19%19%20%20%
D2C & subscriptions share 12%13%12%10%10%
Gross margin 42%44%46%46%47%
EBITDA margin -24%-4%+8%+12%+16%
Headcount (FTE) 48142028

47%

target gross margin by year 5

Green lots 28-38%; roasted lines 55%+; blended across the P&L.

+16%

EBITDA margin at year 5

Drag from roastery and logistics fixed cost falls as volume rises.

28

headcount at year 5

Intense ratio of people to revenue, kept lean by one platform.

Capital allocation, illustrative

20%

Roastery & quality lab

25%

Origin contracts & green inventory

35%

Go-to-market & sales team

20%

Working capital & systems

Illustrative management targets for planning and diligence. Not a forecast of results; the full model, assumptions and sensitivities are available on request.

10 · Profitability

The cup economics, in black and green

Profitability on the retail side is built cup by cup: at a $5.60 cup price and a $0.154 coffee cost per cup, every cup carries $5.45 of gross profit. One brewing unit at current capacity pours 109,200 cups a year, a $611,520 Year 0 revenue base, and this business case compounds that base by +30% in Year 1 and +40% in each of the next three years, to a $2,121,485 Year 4 gross profit.

Gross revenue and gross profit, Year 0 to Year 4

single unit, full year, US$
Gross revenue Gross profit
Year 0
Year 1
Year 2
Year 3
Year 4

Year 0 is current capacity: 109,200 cups at $5.60, coffee cost $16,800. Growth stacks +30% in Year 1, then +40% in each of Years 2, 3 and 4, with the $0.154-per-cup coffee input held constant. This is the retail brewing-unit case beneath the company financial outlook.

Profitability at a glance

One cup, one unit, four years

$5.45

gross profit per cup at $5.60 retail and a $0.154 coffee input

97%

of the cup price remains after the coffee input

109,200

cups per year at current capacity: 300 per day, 2,100 per week

3.6×

Year 0 to Year 4 gross profit: $594,720 to $2,121,485

Business case assumptions

Retail unit economics
Coffee cost
$10.00 / lb
Yield

65 cups / lb

coffee cost per cup: $0.154

Retail price
$5.60 / cup
Gross profit per cup
$5.45
Throughput

20 cups / hour

15 hours / day · 7 days / week

Volume

300 cups / day

2,100 / week · 109,200 / year

Year 0 gross revenue

$611,520

coffee cost: $16,800

Year 0 gross profit
$594,720

Coffee cost per cup is the $10.00-per-pound green cost divided across 65 cups of yield. Throughput assumes 20 cups per hour over a 15-hour, 7-day operating week. All figures are the business case assumptions for this section, refreshed at each model cadence.

Year-by-year, exact

projected gross P&L
Year Gross revenue Coffee cost Gross profit Growth
Year 0 $611,520 $16,800 $594,720 Baseline
Year 1 $794,976 $21,840 $773,136 +30%
Year 2 $1,112,966 $30,576 $1,082,390 +40%
Year 3 $1,558,153 $42,806 $1,515,347 +40%
Year 4 $2,181,414 $59,929 $2,121,485 +40%

Coffee cost scales with cup volume at $0.154 per cup; Year 0 cost is $16,800. Gross profit is revenue less coffee cost, so the year-by-year figures above are exact derivations of the supplied model, not estimates. All figures are plan assumptions for this business case.

Next step

Come see the full model

We keep a working P&L, a sourcing book and a channel plan that move together. Send a note through this form to request the full deck, the financial model or a coffee: the answer time is measured in hours, not weeks.

Planning a national launch, phase one: US wholesale hub you name it

All investor correspondence via this form or the linked channels

Response within 2 business days, most times sooner

l>